Overview Dashboard
Last updated: September 17, 2024
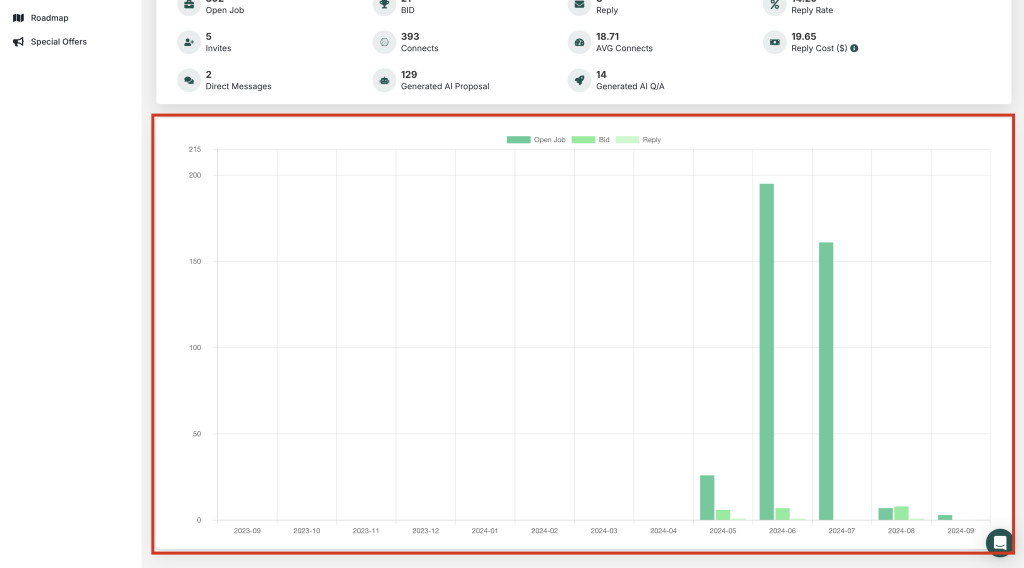
Upwex offers analytics and reporting features for tracking project conversion and success. This includes data on the number of viewed jobs, submitted proposals, replies, and reply rates. There is a chart with information on each individual member or the entire team based on these indicators.
The chart shows the history over the last 7 days, 30 days, 1 month, and 1 year. Additionally, you can see how many times your member has synced with the CRM, as well as how many times they have used proposal or response generation.
These features help freelancers and companies make data-driven decisions and improve their performance on Upwork.
To use this function, click on the Dashboard button on the left side of the service:
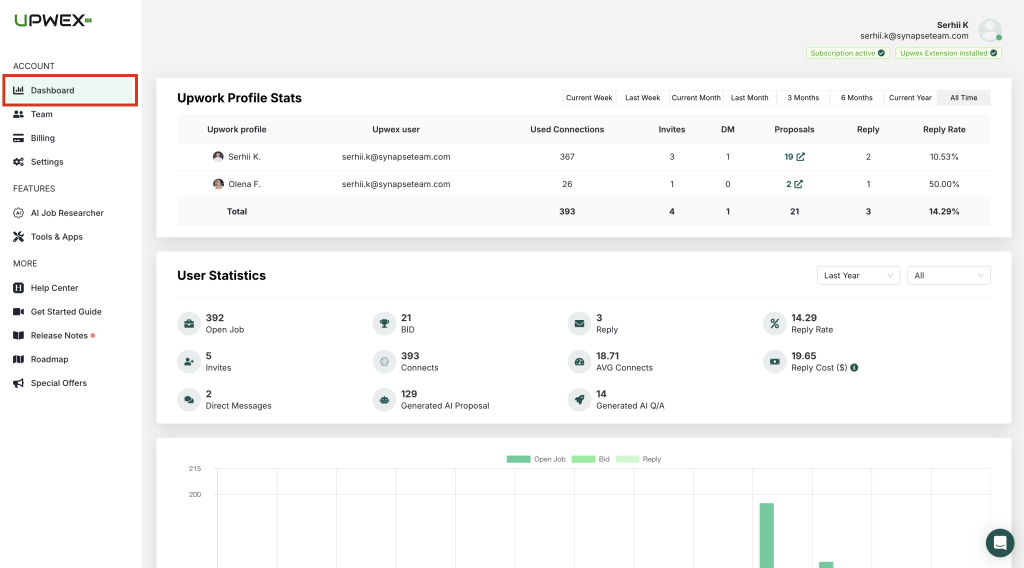
After going to the page, you will be able to see all the functions offered by the Dashboard page:
Upwork Profile Stats:
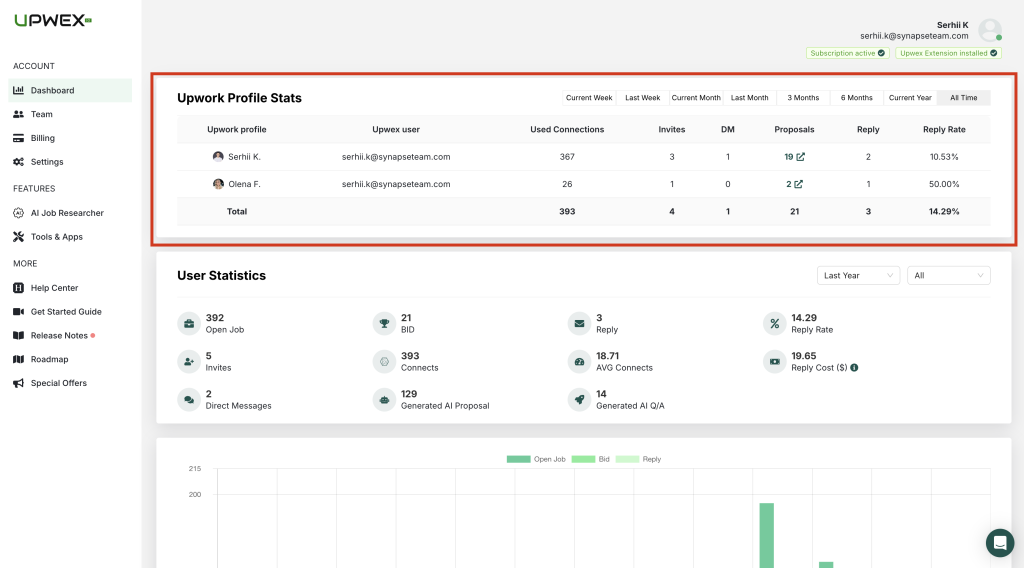
These statistics indicate the information for an individual member and the entire team for the current week/month/year, last week/month, 3 months, 6 months, or All time.
The statistics include data as Used Connections, Invites, DM, Proposals, Reply, and Reply rate.
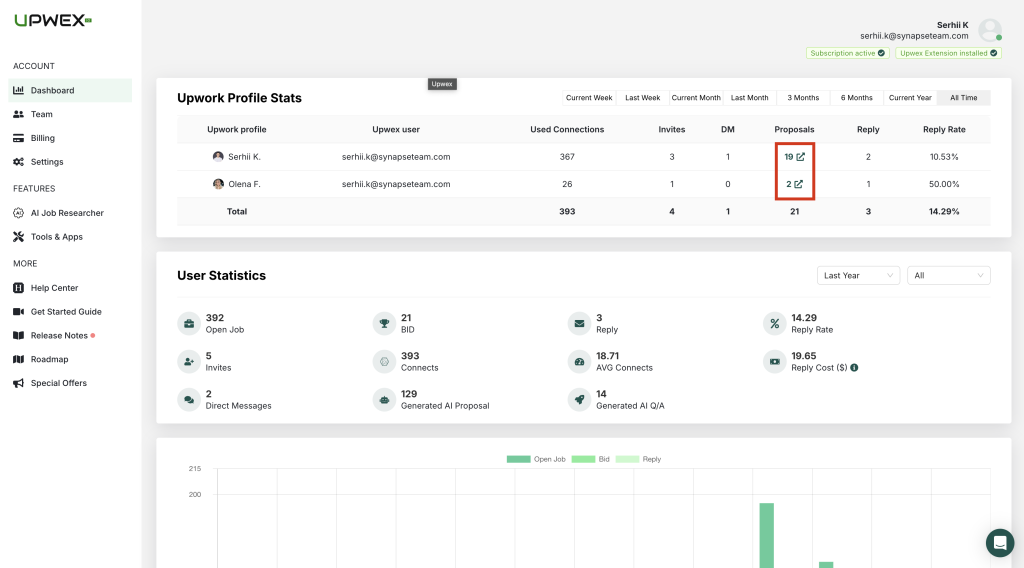
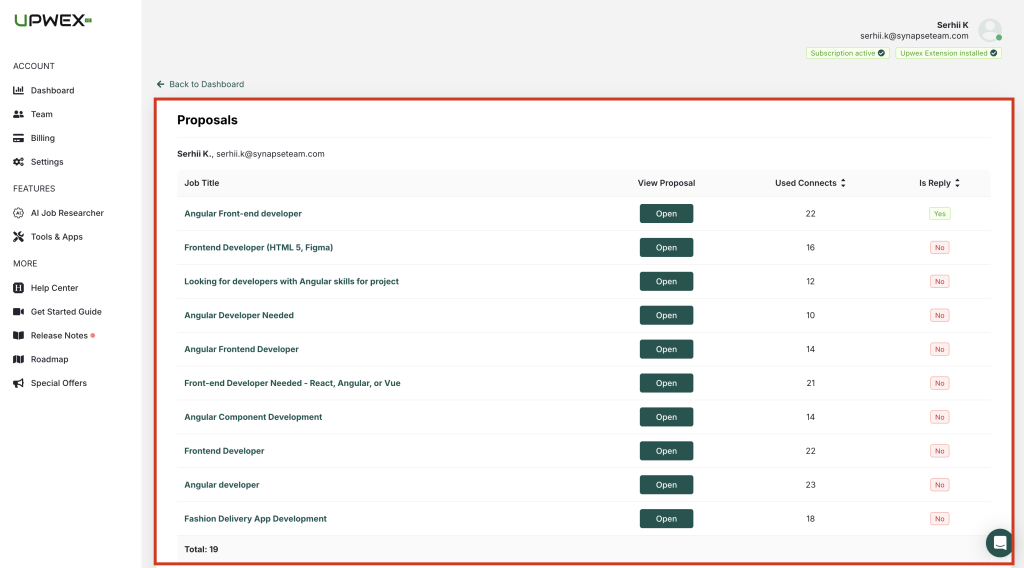
Also, it is possible to check expanded proposals analytics as shown in the screenshot below:
Metrics:
Used Connections – the number of used connections.
Invites – the number of invites you have received.
DM – the number of directed messages.
Proposals – the number of submitted proposals (BIDs).
Reply – the number of responses you have received after submitting a proposal. A response will only be counted if the bid was made by your Upwex account. We will not count the response in the statistics if the bid was made before you started using Upwex
Reply Rate – response conversion rate. Calculated by the formula: (Reply / Bid) * 100.
User Statistics:
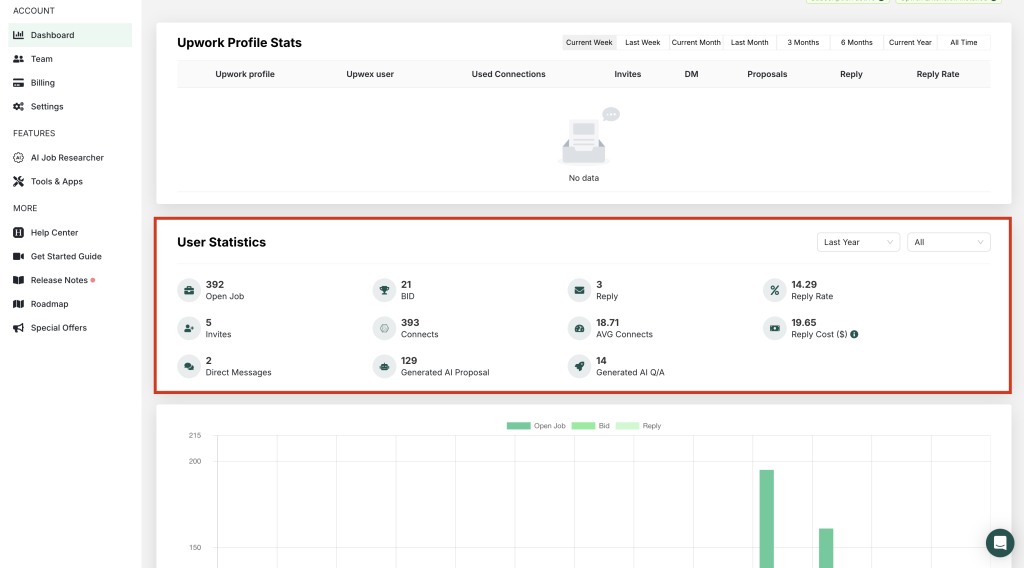
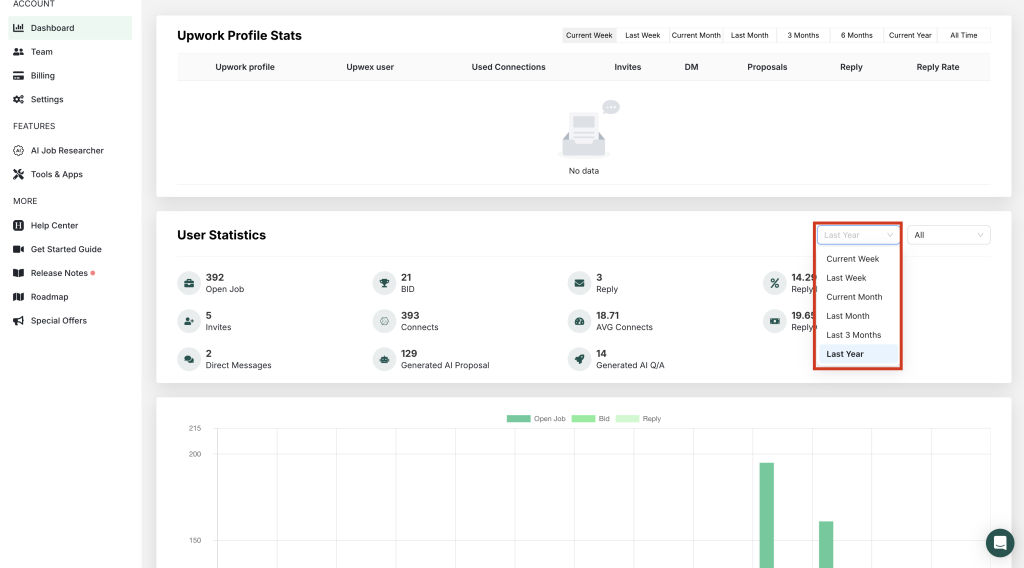
The graphics have 2 filters – the period for which statistics will be displayed and a filter for an individual member or the entire team.
- The period filter shows the history for the last 7 days, 30 days, 3 months, and 1 year:
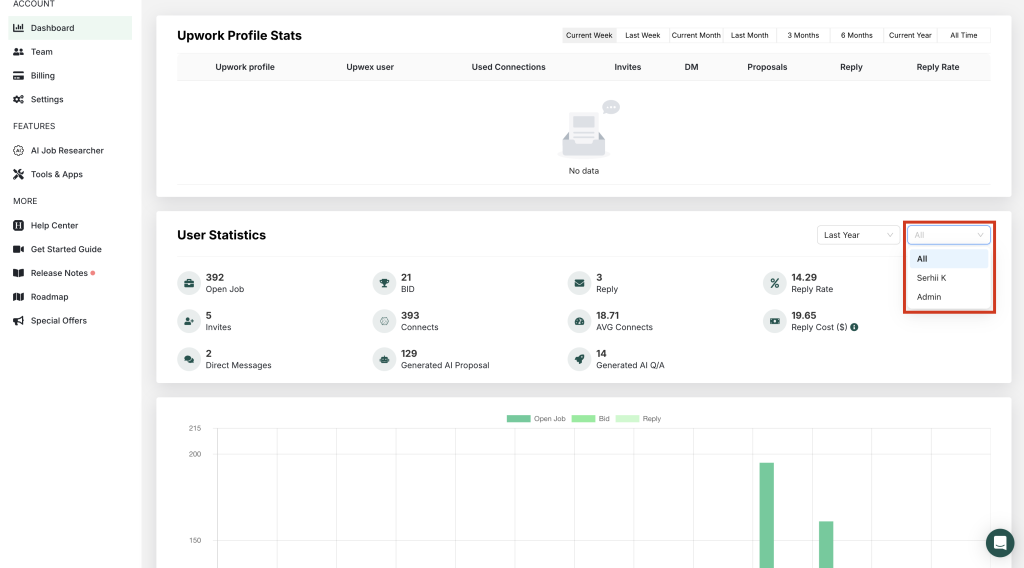
- Also, Upwex analytics provides an opportunity to view the indicators of an individual member or the entire team:
Metrics:
Open Job – the number of viewed jobs on Upwork.
Bid – the number of submitted proposals.
Reply – the number of responses you have received after submitting a proposal. A response will only be counted if the bid was made by your Upwex account. We will not count the response in the statistics if the bid was made before you started using Upwex. Reply Rate – response conversion rate. Calculated by the formula: (Reply / Bid) * 100.
Invites – the number of invites you have received.
Connects – the number of used connections.
AVG Connects – the ratio of Connects to BIDs.
Reply Cost ($) – average price of one response from a customerю The calculation is made taking into account that you buy 300 upwork connections. Reply Сost = Used Connects / 300 * 45$ / Replies.
Direct Messages – the number of direct messages received from customers.
Sync with CRM – the number of synchronizations with CRM. Shows the activity of your profile when working with CRM.
Generated AI Proposal – the number of AI-generated responses for proposals.
Generated AI Answer – the number of AI-generated responses for Q&A.